How do you assess climate hazards?
April 15, 2025
Climate indicators describe the intensity and frequency of climate hazards (events). A hurricane is a hazard. The number of days with wind speed exceeding a critical threshold is an indicator. Climate indicators values and trends are computed weekly, monthly, season-by-season, and yearly. Times series of climate indicators can be delivered also aggregated over 10 .. 30-year window, using the averages or max/min values.
Indicators are always calculate with thresholds. For example, the indicator called the “number of hot days” requires the definition of “hot” threshold. The indicator for the number of heavy rainfall days requires the definition of “heavy”.
Critical thresholds can be set in two ways :
- the absolute values, or
- percentiles
Percentiles are calculated relative to the corresponding distribution ("climatology") for the same location, month-by-month, using historical data. In this case, heatwave and cold stress threshold is unique for each location. You need at least 30 years of historical daily data to reliably evaluate the 10% tail of the distribution.
Relative thresholds with percentiles are particularly useful if you need to compare indicators, anomaly time series and hazards across different locations in different climate zones. For detailed analysis, however, indicators calculated using absolute thresholds are more informative and easier to interpret.
Depending on the Use Case and the industry (agriculture vs manufacturing), the choice of Climate Indicators and the exact definition of critical thresholds can vary. The most popular indicators are listed here in these Tables.
Heat Wave and Cold Stress
Heat Waves and Cold Stress can occur in any season. Winter heat waves can affect wheat production, lead to failures in apple and other fruit production in the following season, create dangerous icing conditions on roads and railways, and impact power grids. Heat waves can also occur anywhere on the globe, even offshore.
Heat waves can be calculated using :
- the absolute thresholds:
- days with min/max temperature exceeding 30°C or 40°C, or
- days with min/max daily temperature bellow freezing, or
- days with min/max daily temperature bellow/above the historical record for this specific location
- the relative thresholds: days with maximum temperature exceeding the upper 10-th percentile (or bellow the lowest 10-th percentile) for the same calendar month
For Heat Wave and Cold Stress risk scoring, in order to create comparable risk metric, we suggest using relative indicators.
Table 1: Temperature-based climate indicators
|
Short name |
Description how this climate indicator is calculated |
|
Yearly highest Tmax |
The yearly maximum air temperature is derived by identifying the hottest day of each year |
|
Nb of days max temp > 30°C |
30-year average number of days with maximum daily temperature exceeding this threshold |
|
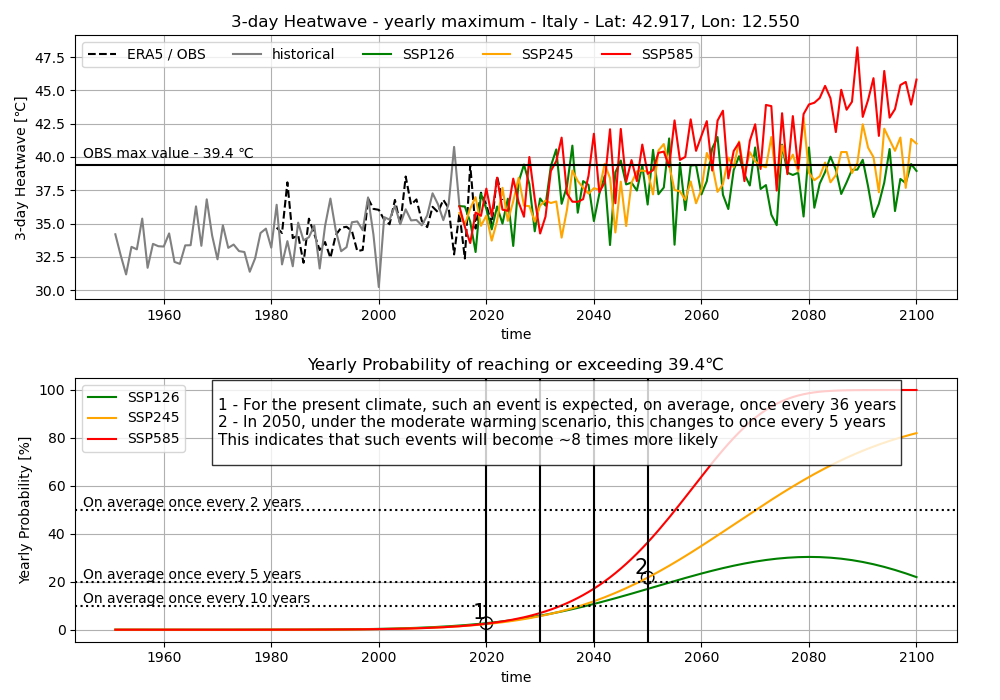
3-day Tmax |
The annual Maximum of the 3-day running mean of daily maximum temperatures |
|
Cooling degree days |
Annual sum of daily temperature anomalies exceeding the threshold of 18°C |
|
Heating degree days |
Annual sum of daily temperature anomalies bellow the threshold of 18°C |
Extreme Rainfall
For Extreme Rainfall and Severe Storm risk assessment and risk rating, we suggest using these indicators with absolute critical thresholds (see Table 2 and Table 4).
Useful to note: all climate and weather models tend to underestimate the frequency and intensity of extreme rainfall. As a result, they are generally conservative, the “worst-case” they represent is not necessarily the true worst that can occur.
Table 2: Precipitation-based climate indicators
|
Short name |
Description how this climate indicator is calculated |
|
R20mm |
Very heavy rainfall days with precipitation ≥ 20 mm/day [days] |
|
R5d |
Consecutive 5-day cumulative rainfall |
|
CWD |
Wet Spell Duration index |
|
R75P |
Number of days with the precipitation above a 75-th percentile |
Drought, Wildfire and Heat Stress
Table 3 : Combined climate indicators with Temperature and Rainfall
|
Short name |
Description how this climate indicator is calculated |
|
SPEI |
Annual Standardized Precipitation and Evapotranspiration Index |
|
SPEI3 |
The seasonal drought is based on SPEI with a 3-month rolling average |
|
CDD |
Consecutive Dry Days index |
|
Heat Stress - Nb of Extreme caution days |
The annual count of days on which the critical thresholds are met. Tmax > 30°C |
|
Heat Stress - Nb of Danger days |
The annual count of days on which the critical thresholds are met. Tmax > 40°C |
|
WFI |
Canadian Fire Weather Index |
|
Water stress index |
Annual ratio between human demand versus available water resources |
|
Water balance |
Annual precipitation minus potential evapotranspiration (Makkink index) |
Severe Storm
Indicators for storm activity can be based on wind speed alone or may also include precipitation and sea level pressure. Storms with higher precipitation and lower pressure are more dangerous. In WTN’s definition, hail is one of the input datasets used for severe storm risk assessment. Standard indicators used for storm activity assessment are listed in Table 4.
Useful to note: all climate and weather models tend to underestimate the frequency and intensity of extreme winds. As a result, they are generally conservative, the “worst-case” they represent is not necessarily the true worst that can occur.
Table 4: Wind-based climate indicators
|
Short name |
Description how this climate indicator is calculated |
|
WID |
Number of stormy days with maximum daily wind speed ≥ 13.9 m/s |
|
BLS |
Number of stormy days with maximum daily wind speed ≥ 13.9 m/s and precipitation ≥ 10 mm/day |
|
Tropical cyclone [nr storms / 100 yr] |
Counting occurrences of storms reaching 45 km/h wind speed over 100 years |
|
Category 1 hurricane [nb storms / 100 yr] |
A storm is counted if its maximum wind reaches 120–150 km/h. Counting occurrences of storms reaching this threshold over 100 years |
|
Category 2 hurricane [nb storms / 100 yr] |
Category 2 = 150–180 km/h. Counting occurrences of storms reaching this threshold over 100 years |
Probability time series
The probability time series are derived from the time series of each indicator. The more models and the longer the dataset included, the lower the uncertainty and the higher the confidence in the results.
The probability assessment for each hazard and location is based on climate indicators calculated in-house by our team.
If an event occurs once every 100 years, its return period is 100 years, meaning there is a 1% probability (1 / 100 years) of it occurring in any given year.
Interpretation:
A "present: probability of 65% means the event is expected to occur 65 times over 100 years. And it happened already!
High probability of 100% means the event is expected to occur 100 times over 100 years. Something that happens every year: it's not a hidden risk, it's a "normal" thing for this area!
A probability of 300% means the event occurs 300 times over 100 years: three times per year
Useful to note: a “once in 100 years” event does not mean "it will happen in 100 years". It could happen this year, next year, or even several times within a short period, there is no fixed schedule. Those who have ignored this risk in building design or in power and water supply systems will be the most affected. Knowledge of exposure allows companies and municipalities to prepare for worst-case scenarios, anticipate major damage, avoid last-minute chaos, and reduce losses and irreversible consequences.
Scenario analysis
Time series for climate indicators for each forward-looking climate scenario can be represented as trends. We can quantify the change relative to the historical reference, see examples in Table 5.
Table 5: Scenario analysis for climate indicators
|
Climate Indicator |
Present |
2050 |
2050, RCP8.5 |
|
Cooling Degree Days |
1800 degree days |
+31 % |
+39 % |
|
Category 2 hurricane [probability] |
7.5 % |
+0.5 % |
+1.2 % |
|
R20mm [days / year] |
12 |
+16 % |
+14 % |
When the probability value in the column "PRESENT" is not zero, it means the extreme has already been observed in the past, it has occurred and is not an emerging risk. The amplitude of trends should always be considered in the context of the reference value (see “Present” columns).
Useful to note: when comparing different scenarios, trends are not necessarily more intense under a high-emissions (“hothouse world”) scenario. In some regions, certain risks may decrease or be less pronounced even under this worst-case warming scenario.
Input raw weather and climate data
Indicators are calculated using the data from state-of-the-art CMIP6 climate model simulations, high-resolution satellite observations, and additional scientific weather datasets. The list of raw data sets is regrouped here.
What is the difference between WTN and raw data providers.
Raw data sources, such as weather and climate models, provide parameters. Daily wind speed, rainfall and temperature are parameters. The number of days with wind speed exceeding a critical threshold is an indicator. At WTN, we then compute climate indicators to assess climate hazards. A hurricane, heat wave, or flood is a hazard. We not only develop advanced risk metrics for each hazard and location, but also process the data so that it takes only seconds to identify “pain points” for a company with thousands of sites. We deliver decision-ready data by aggregating scientific datasets and observations to identify at-risk locations, even when they are considered “safe” according to official public sources.
To calculate climate indicators we suggest using methodologies defined by the Expert Team on Climate Change Detection and Indices (ETCCDI) and the WMO Commission for Climatology’s Expert Team on Sector-specific Climate Indices (ET-SCI). For developpers and data scientists, x-clim python library is very useful and contains lots of technical documentation.
Tailored risk analysis
If you need Climate Indicator data (in Excel format) or you need support to select the most relevant indicators for a specific use case, we are happy help : contact@weathertrade.net
You are also welcome to join our weekly methodology workshops, where we answer your technical questions and provide detailed explanations of our data analytics, risk assessment methods, and their integration into civil engineering. The program of our weekly workshops is available HERE