Climate Risk Expertise
for Corporate Risk Management
Unlock the power of decision-making tools for your real estate investments, portfolio diversification, credit risk, asset valuation, parametric insurance, and climate proofing
Empower your business with comprehensive analytics and detailed asset-level data for all climate hazards - flood, wildfire, drought ... storms, heatwave - worldwide
Improve your sustainability compliance with quality physical climate risk assessment
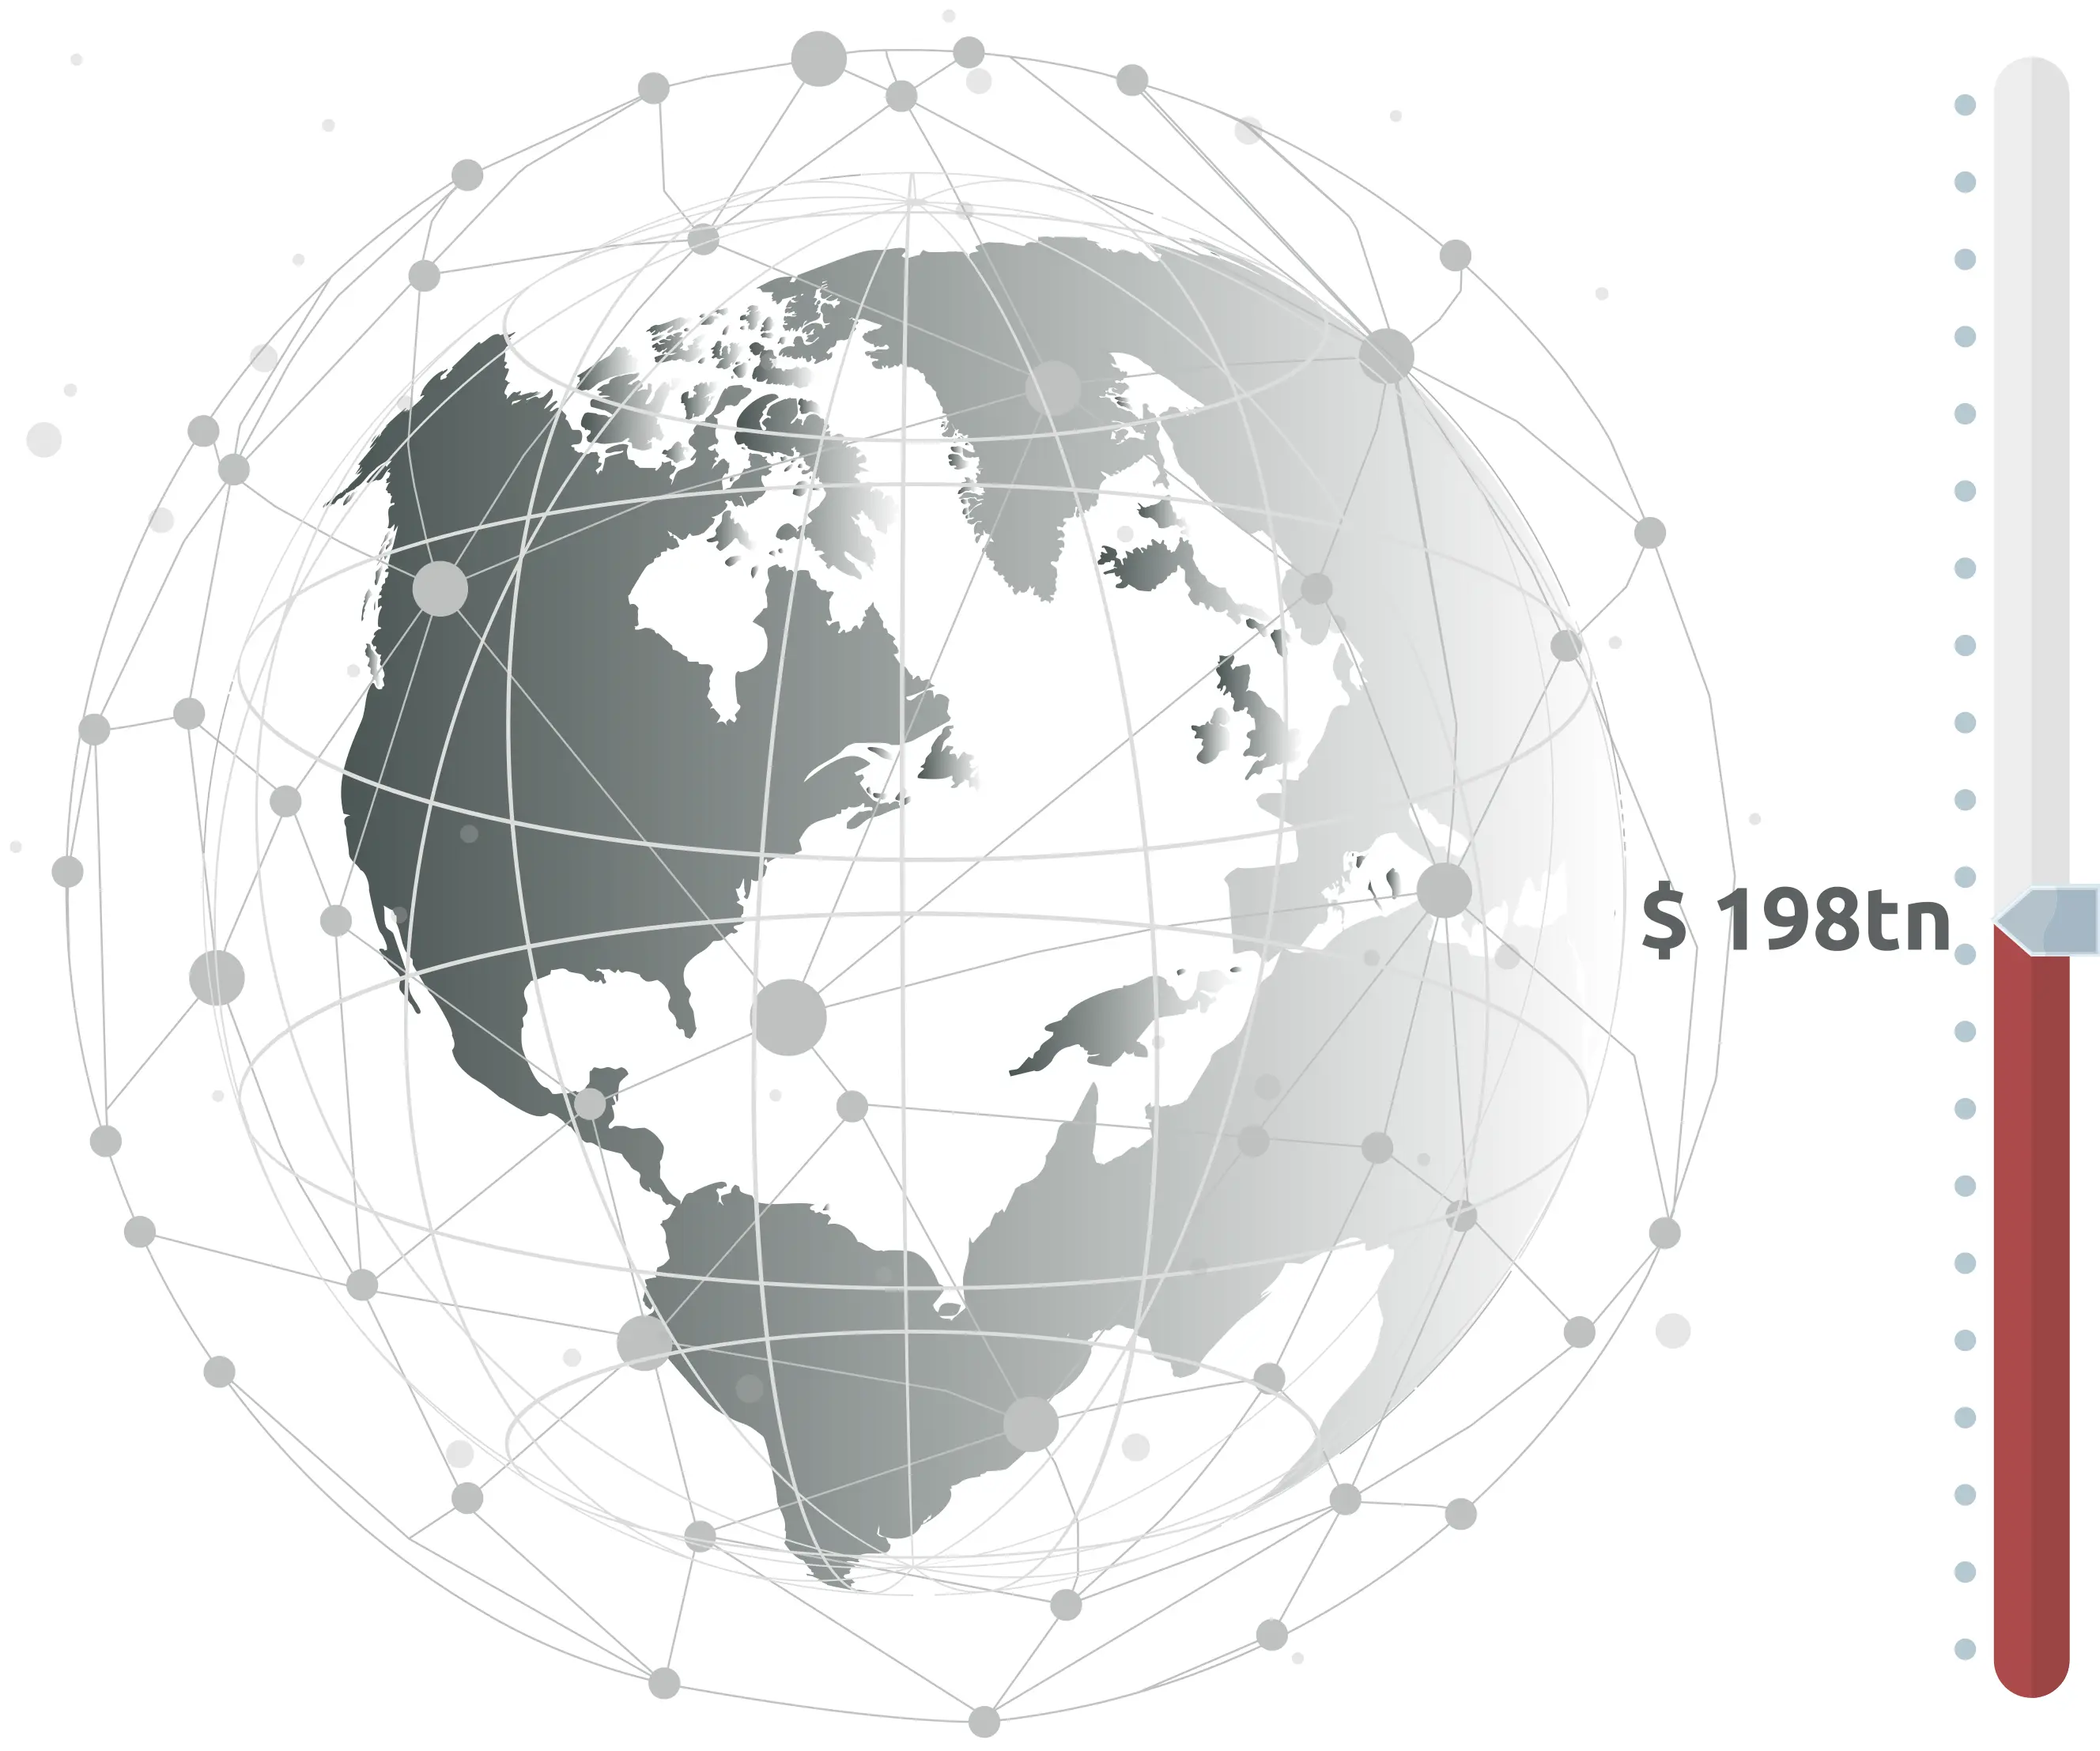
Are you aware of your climate risk exposure?
...
Instant data access
Asset-level & Company-level
Country & Region-State level
METHODOLOGY
High granularity
Global coverage
Scenario analysis
Automated diagnostics
Aligned with CSRD ESRS E1 & IFRS S2
Our partners and clients


Testimonials
ABOUT
Bridging Climate Data Gaps Globally
Our mission: Building Resilient Future
Our DNA: turning risk metrics into action
Using AI for climate risk detection
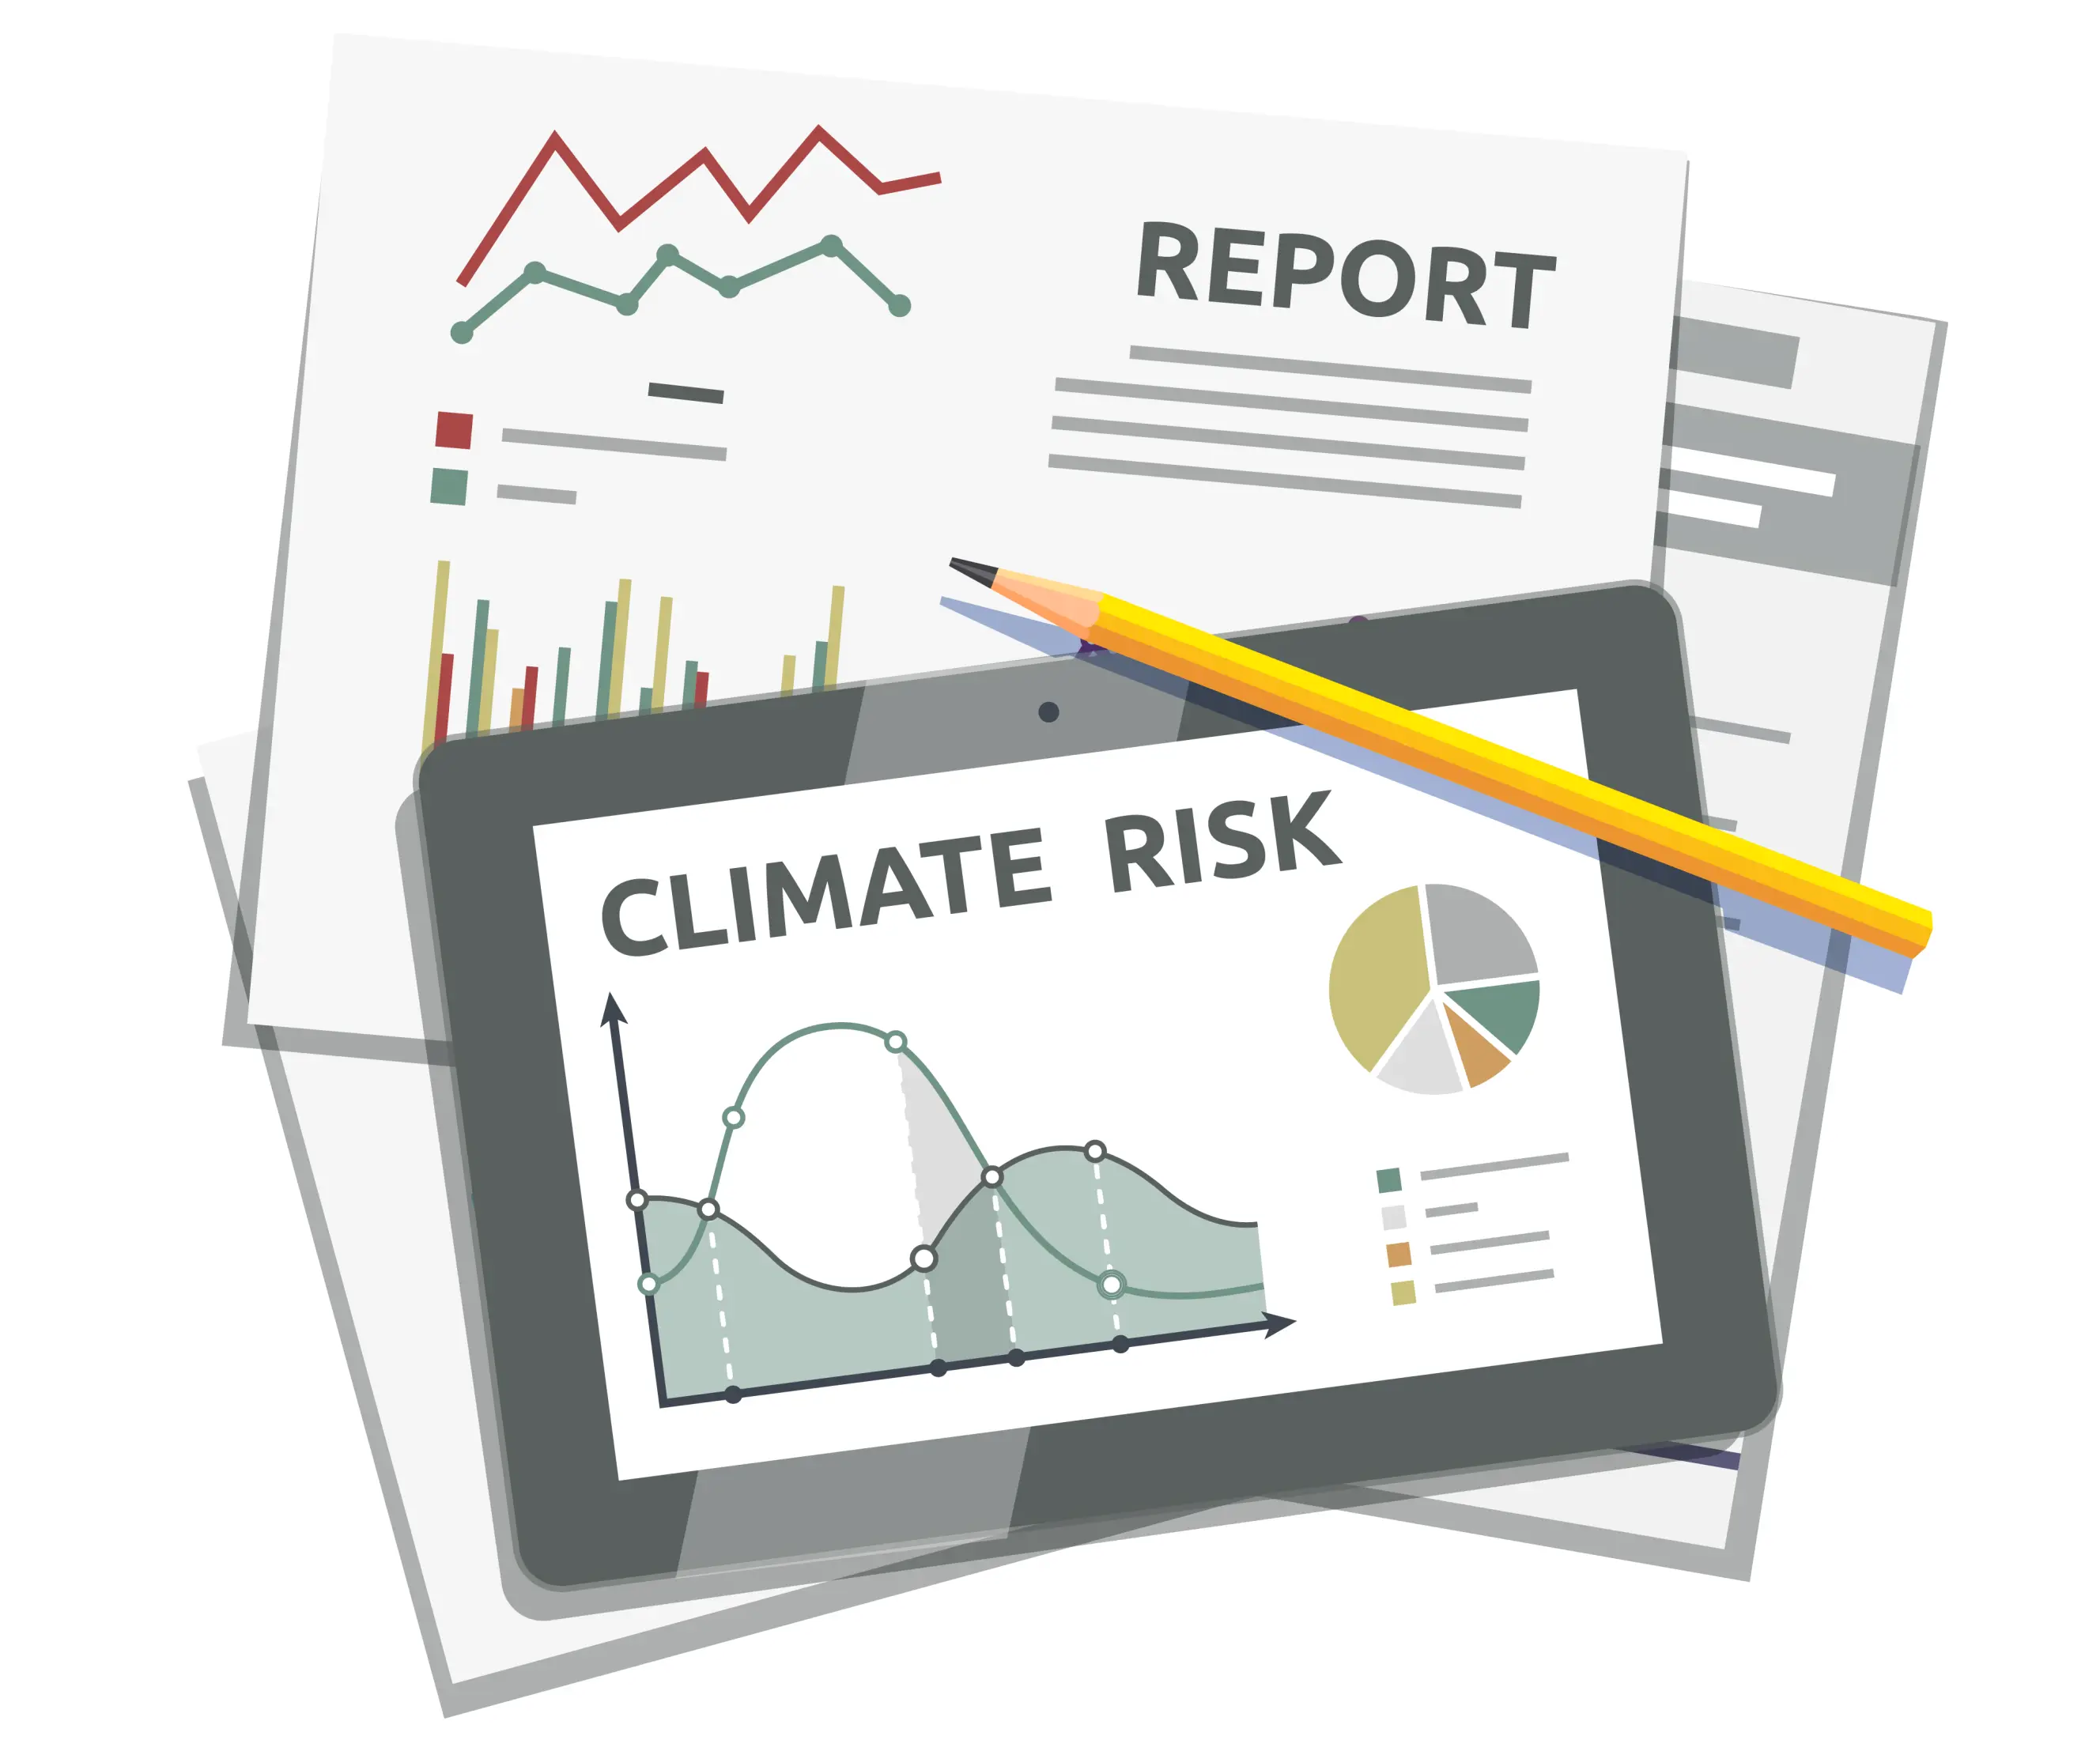
WTN provides a broad range of climate risk assessment products tailored for businesses. Our climate risk metrics are designed to help align risk management with investment decisions and meet new ESG compliance standards. These metrics are standardized, globally comparable, intuitive and complete. They’re also structured for straightforward integration, easily accessible, and ready for immediate use.
Technology
Instant data access
All climate risk metrics is accessible at one place in self-service
Immediate analytical reporting for user-defined geolocations (PDF & XLS)
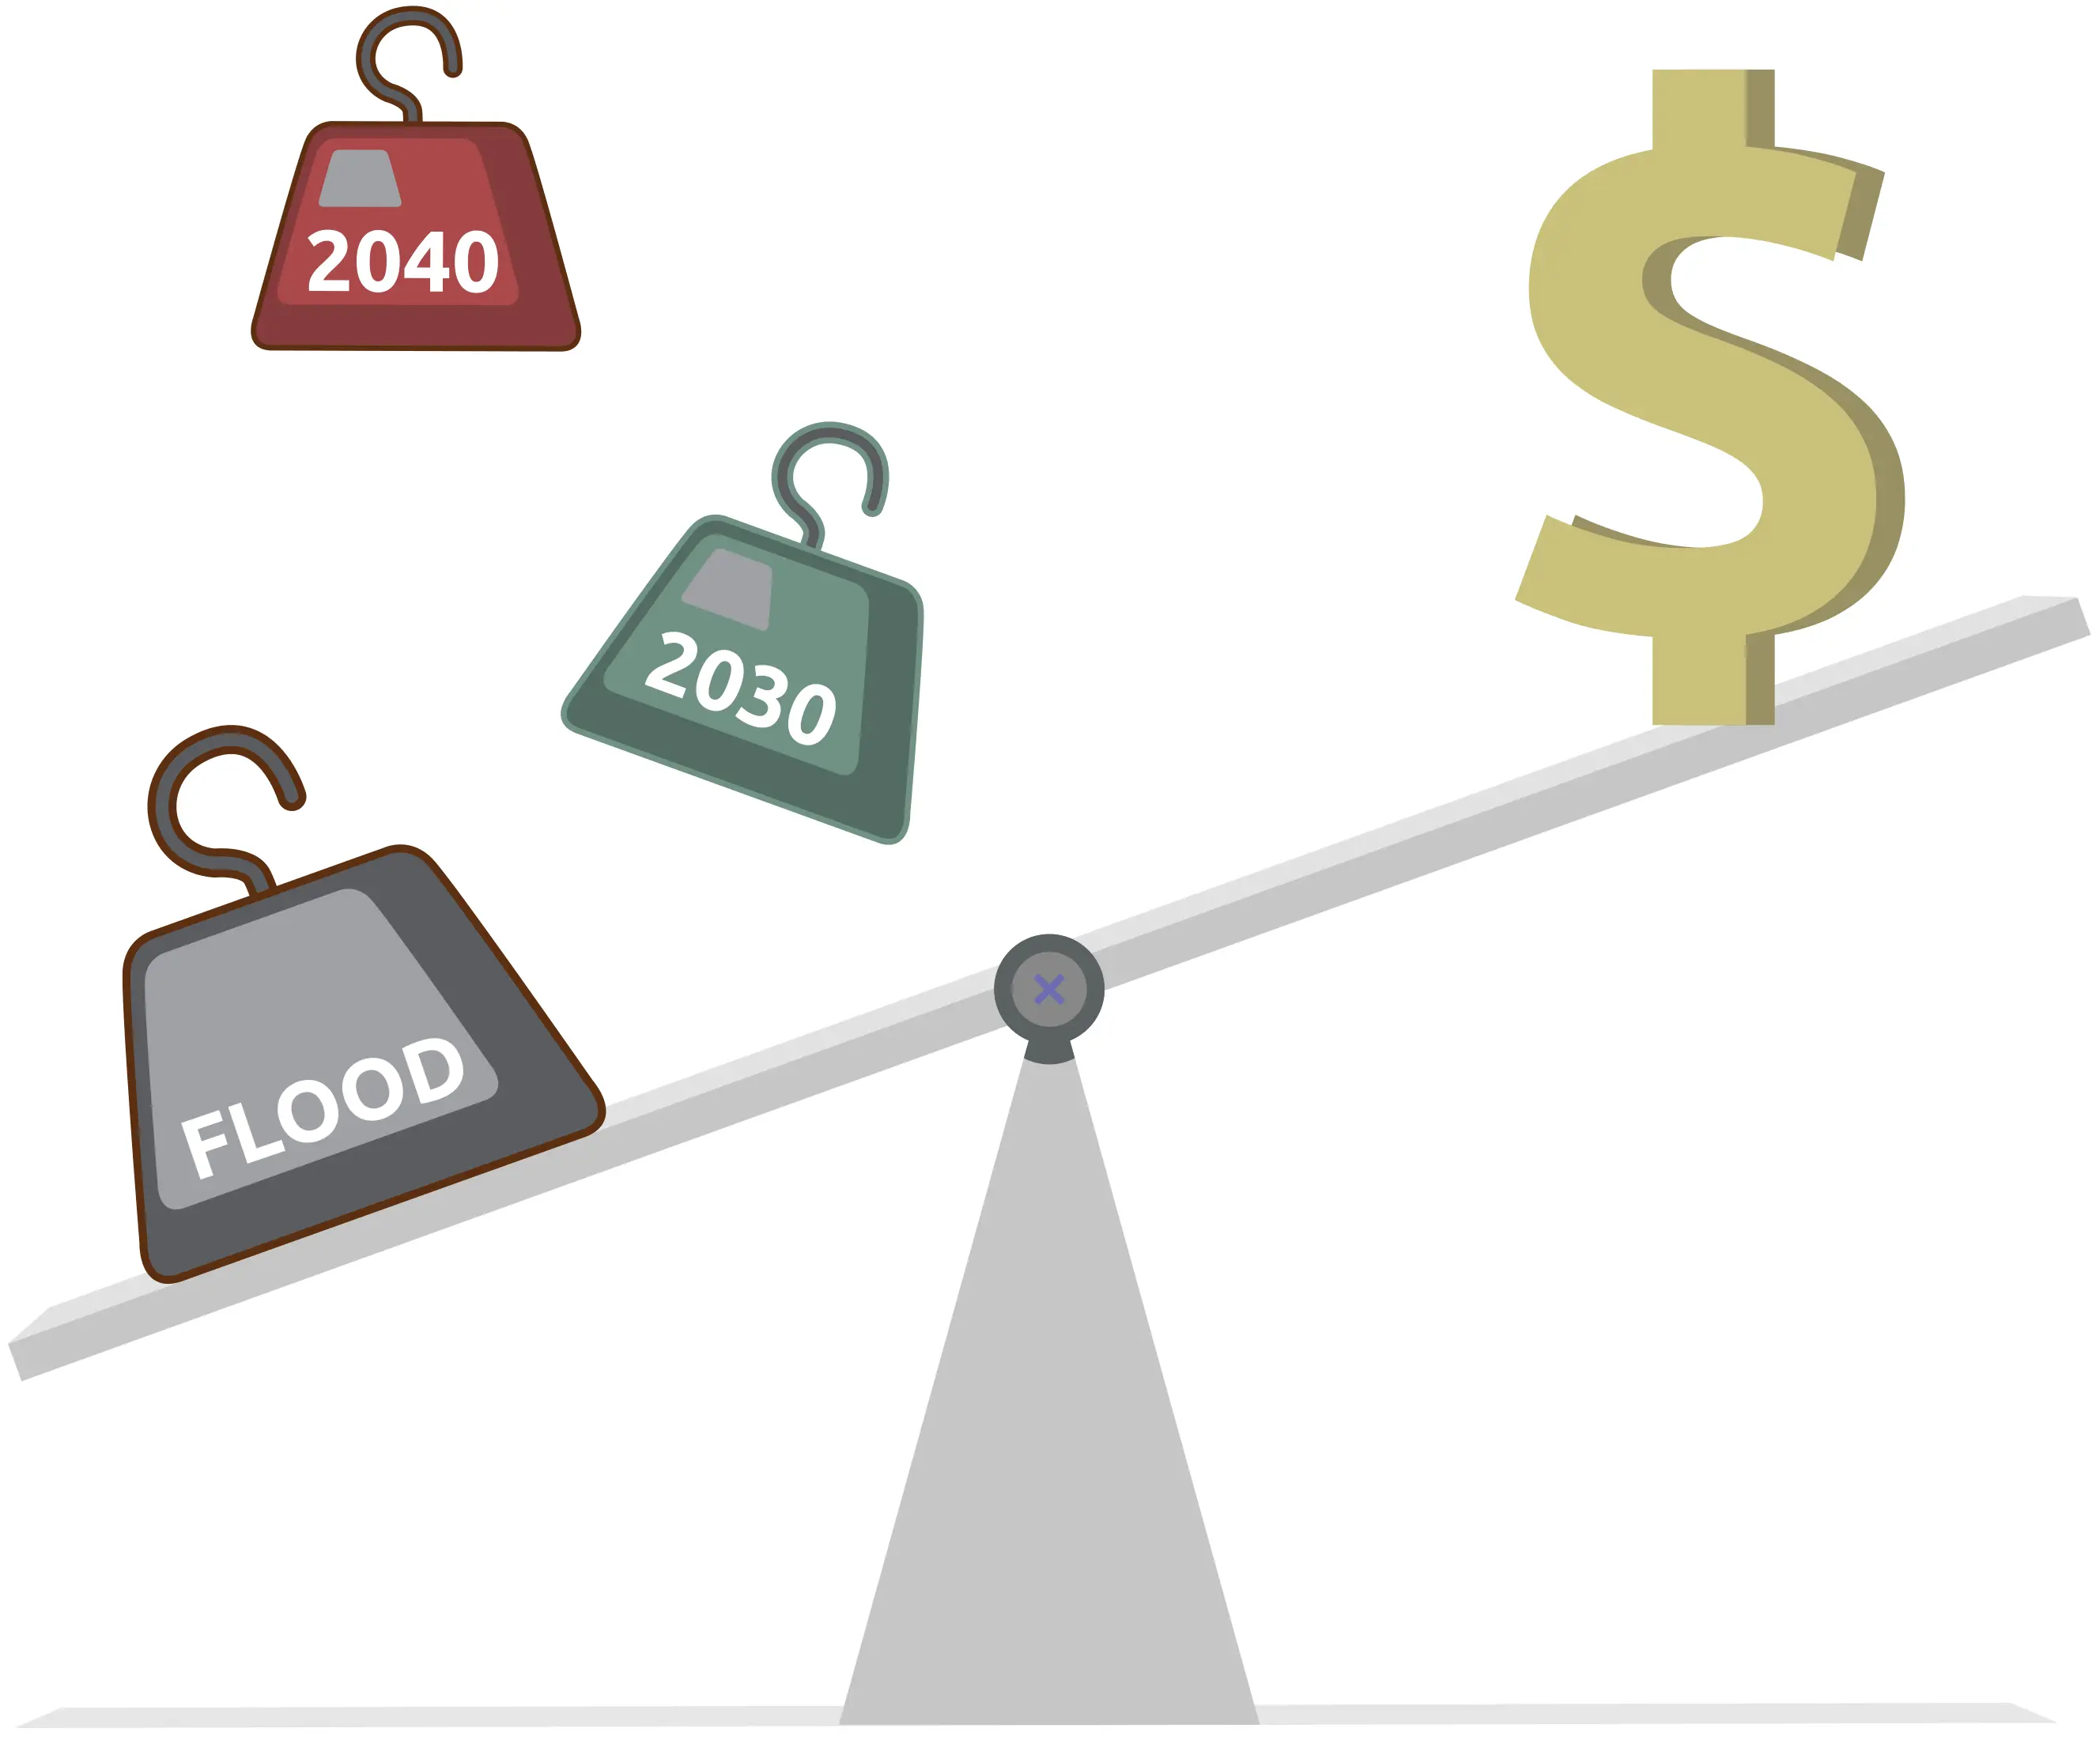
Historical & forward looking
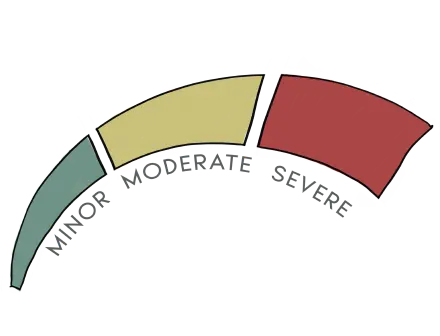
Risk rating
Probabilities


Quantitative algorithmic solutions
Team


Get in Touch
+44 7537 12 15 17